How to Generate Graphs and Charts in ChatGPT by OpenAI

OpenAI’s ChatGPT has been doing wonders ever since it was launched. And if you are eager to learn how to Generate Graphs and Charts by using the tool, this short blog post is for you.
Let’s get to it…
Using ChatGPT to Generate Graphs and Charts
Below, I will be providing you with 2 different example prompts along with working screenshots so that you can get it done easily.
🎉 For this operation, uploading files is completely optional. The output will just be fine even without uploading any files, depending upon the prompt given.
Prompt #1
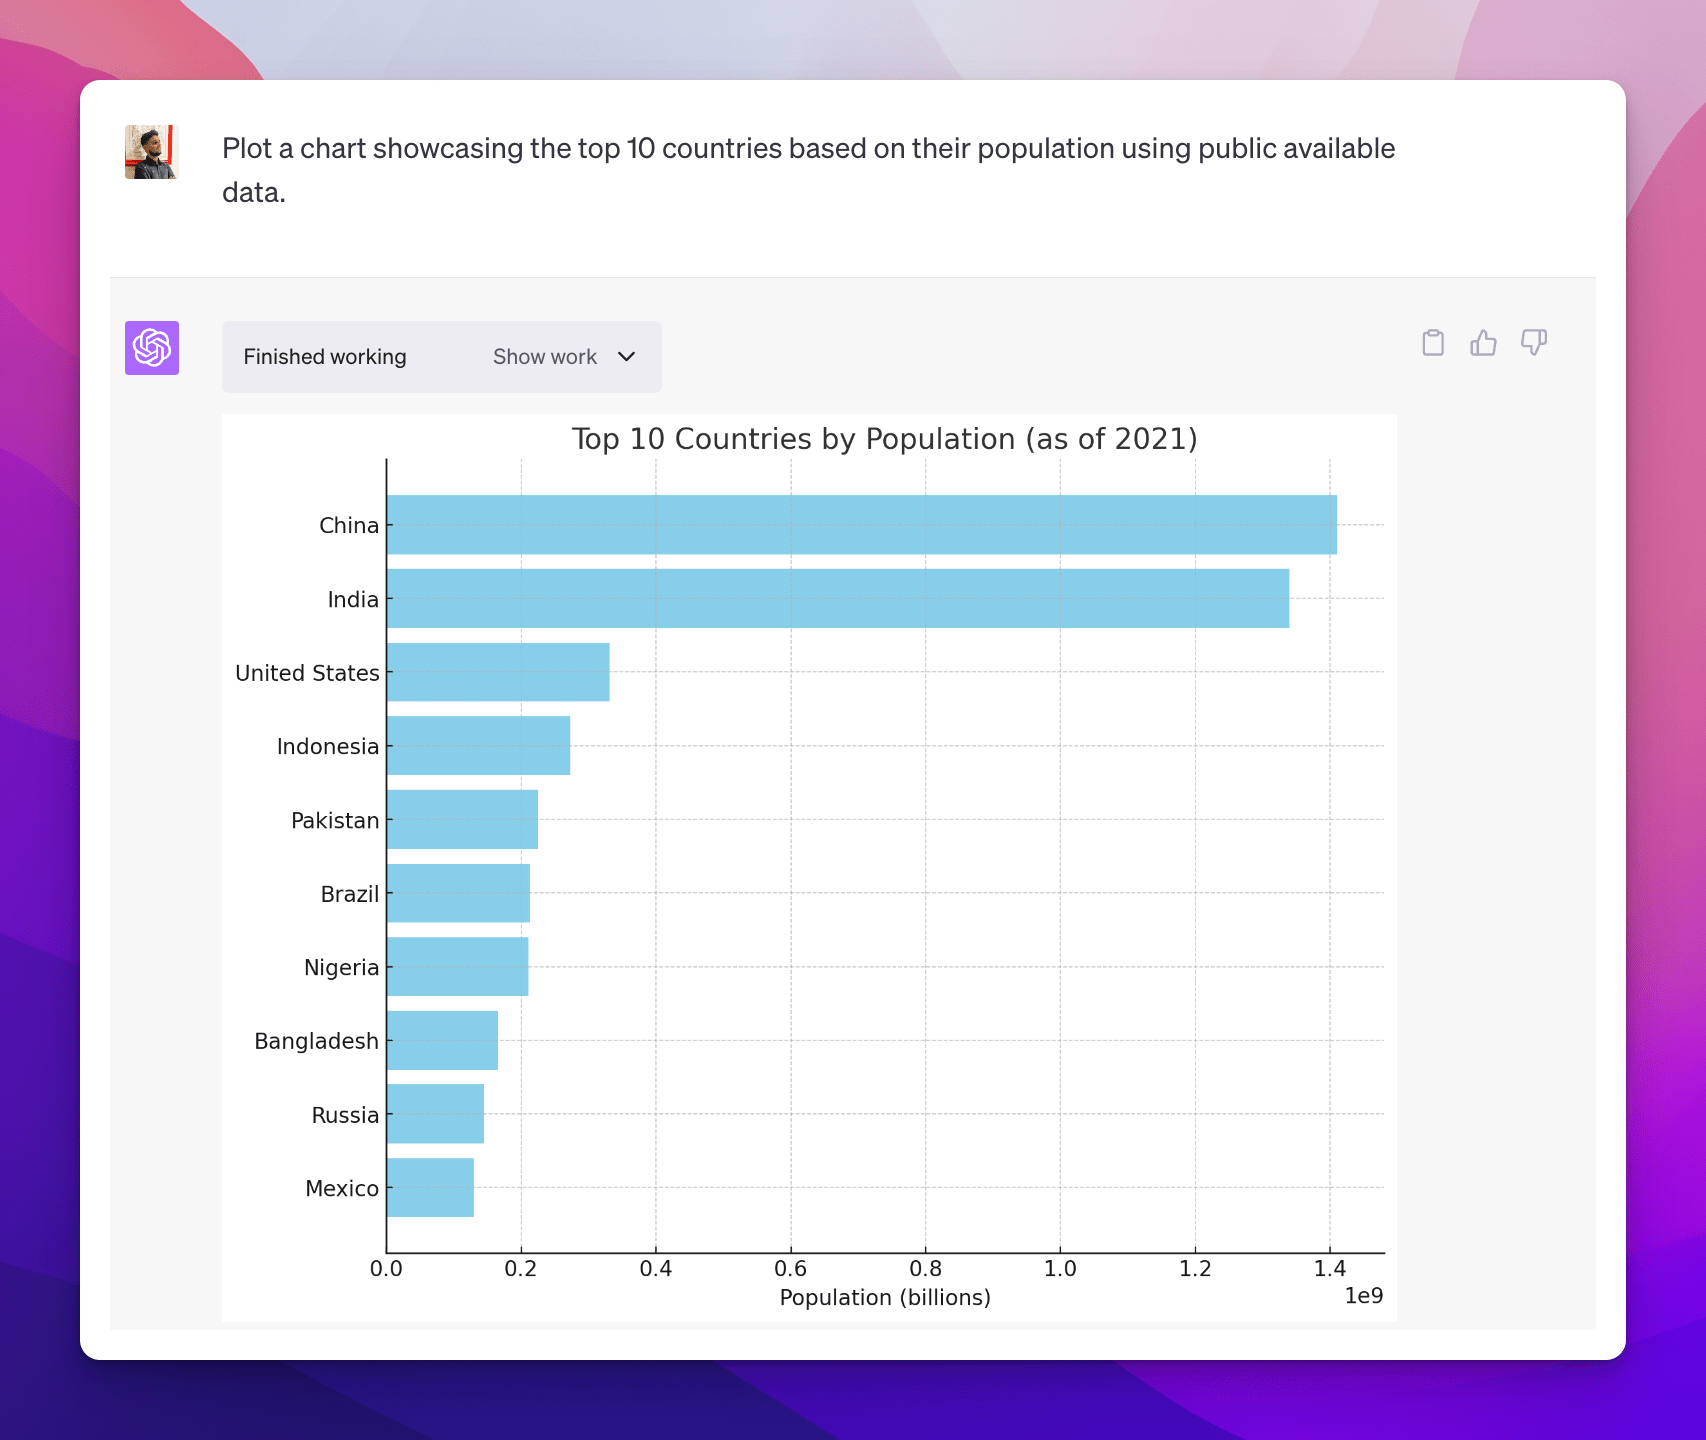
Plot a chart showcasing the top 10 countries based on their population using public available data.
This prompt instructs the ChatGPT to generate code that creates a chart. The chart visualizes the top 10 countries by population, using publicly available data as its source.
Prompt #2
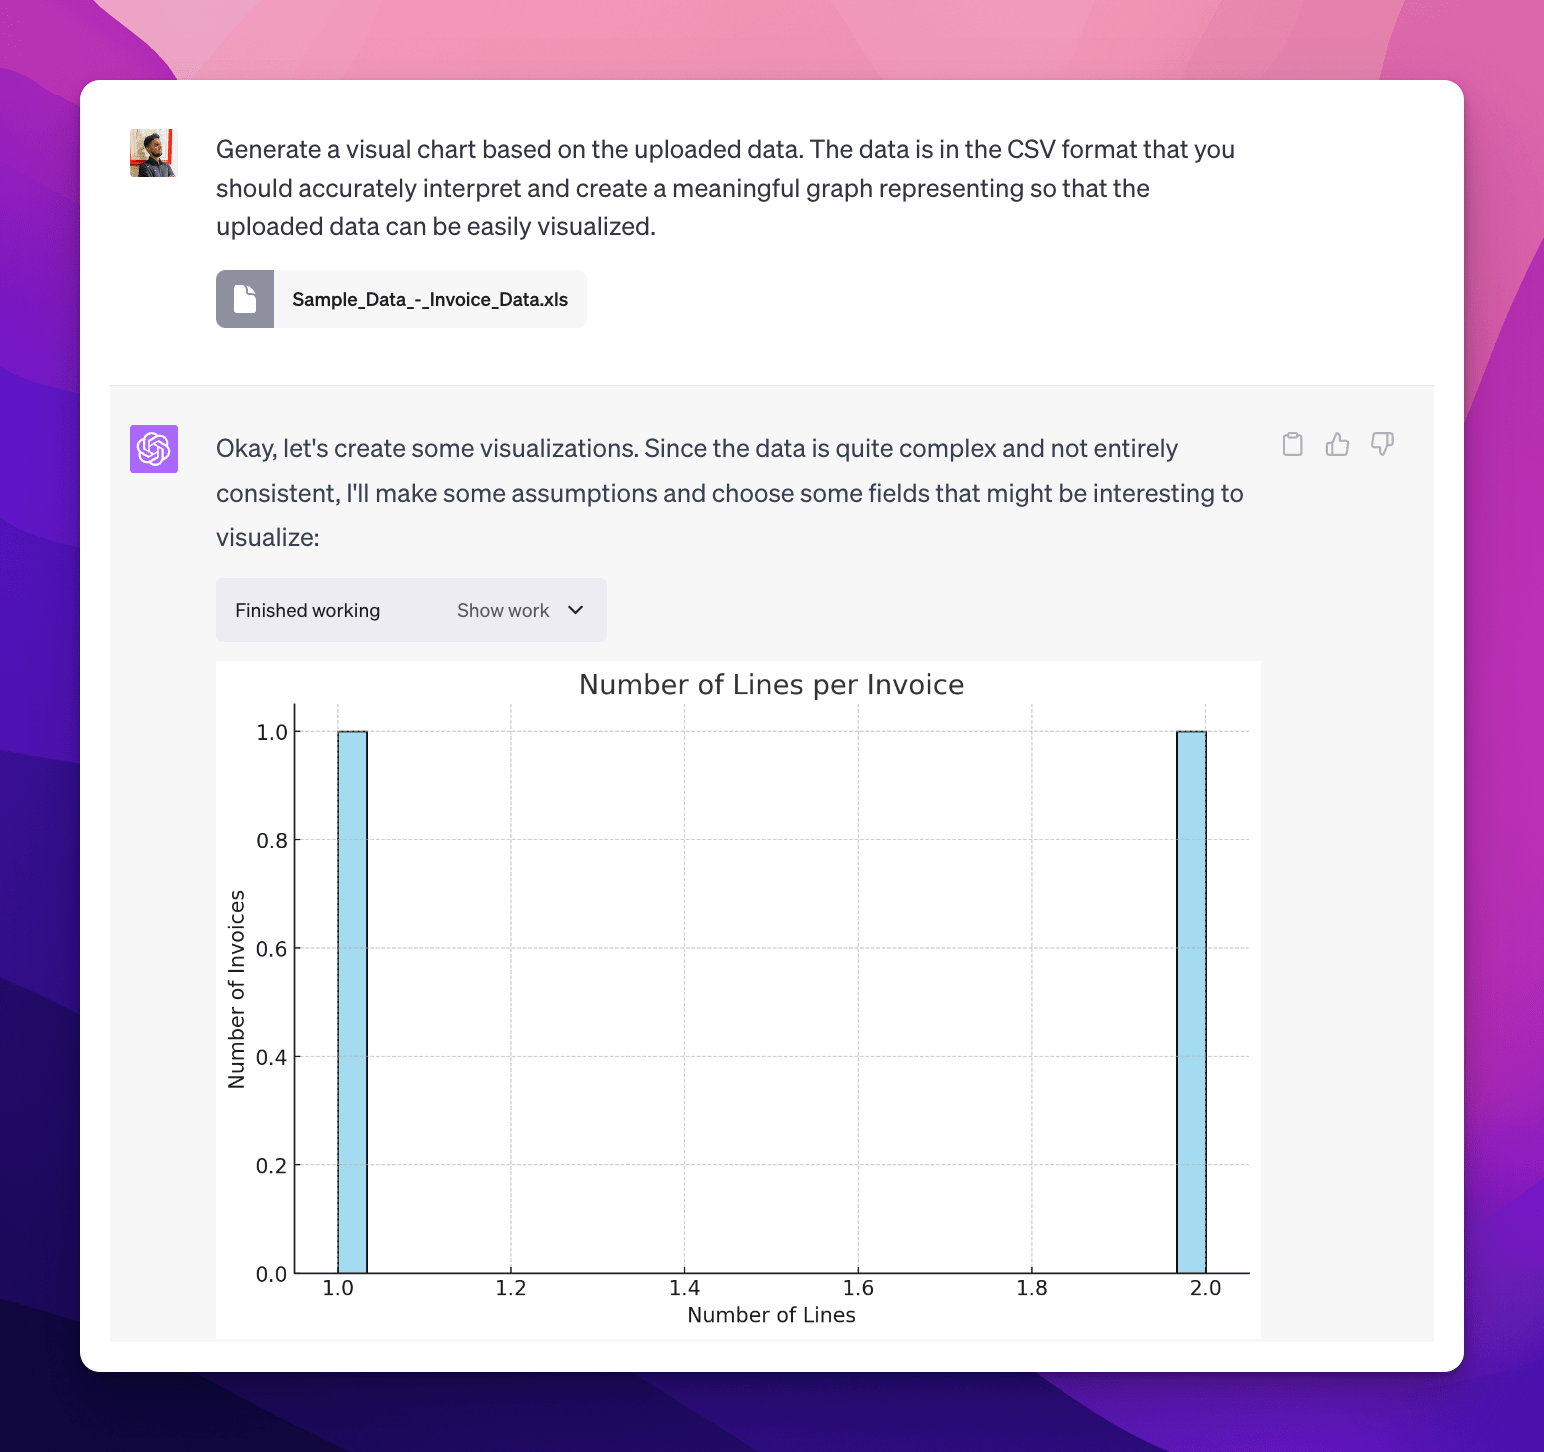
Generate a visual chart based on the uploaded data. The data is in the CSV format that you should accurately interpret and create a meaningful graph representing so that the uploaded data can be easily visualized.
This prompt directs the ChatGPT to create a graphical representation from an uploaded CSV data file. It involves reading the CSV file, accurately interpreting its contents, and then generating a chart that effectively visualizes the data.
🎉 You can modify the above prompts as per your use case to get the desired output. OpenAI’s GPT-4 is powerful and properly understands any prompt you provide.
Also, check some other interesting things that you can do with the OpenAI’s ChatGPT:
And if you get stuck somewhere, kindly feel free to let me know in the comments below.
