OpenAI’s ChatGPT has been doing wonders ever since it was launched. And if you are eager to learn how to Plot Mathematical Functions by using the tool, this short blog post is for you.
Let’s get to it…
Using ChatGPT to Plot Mathematical Functions
Below, I will be providing you with 2 different example prompts along with working screenshots so that you can get it done easily.
🎉 You don’t need to upload any files for this operation, just a detailed prompt is enough.
Prompt #1
Plot the graph of the function f(x) = 1/sin(x) over the range from x = -π/2 to x = π/2.
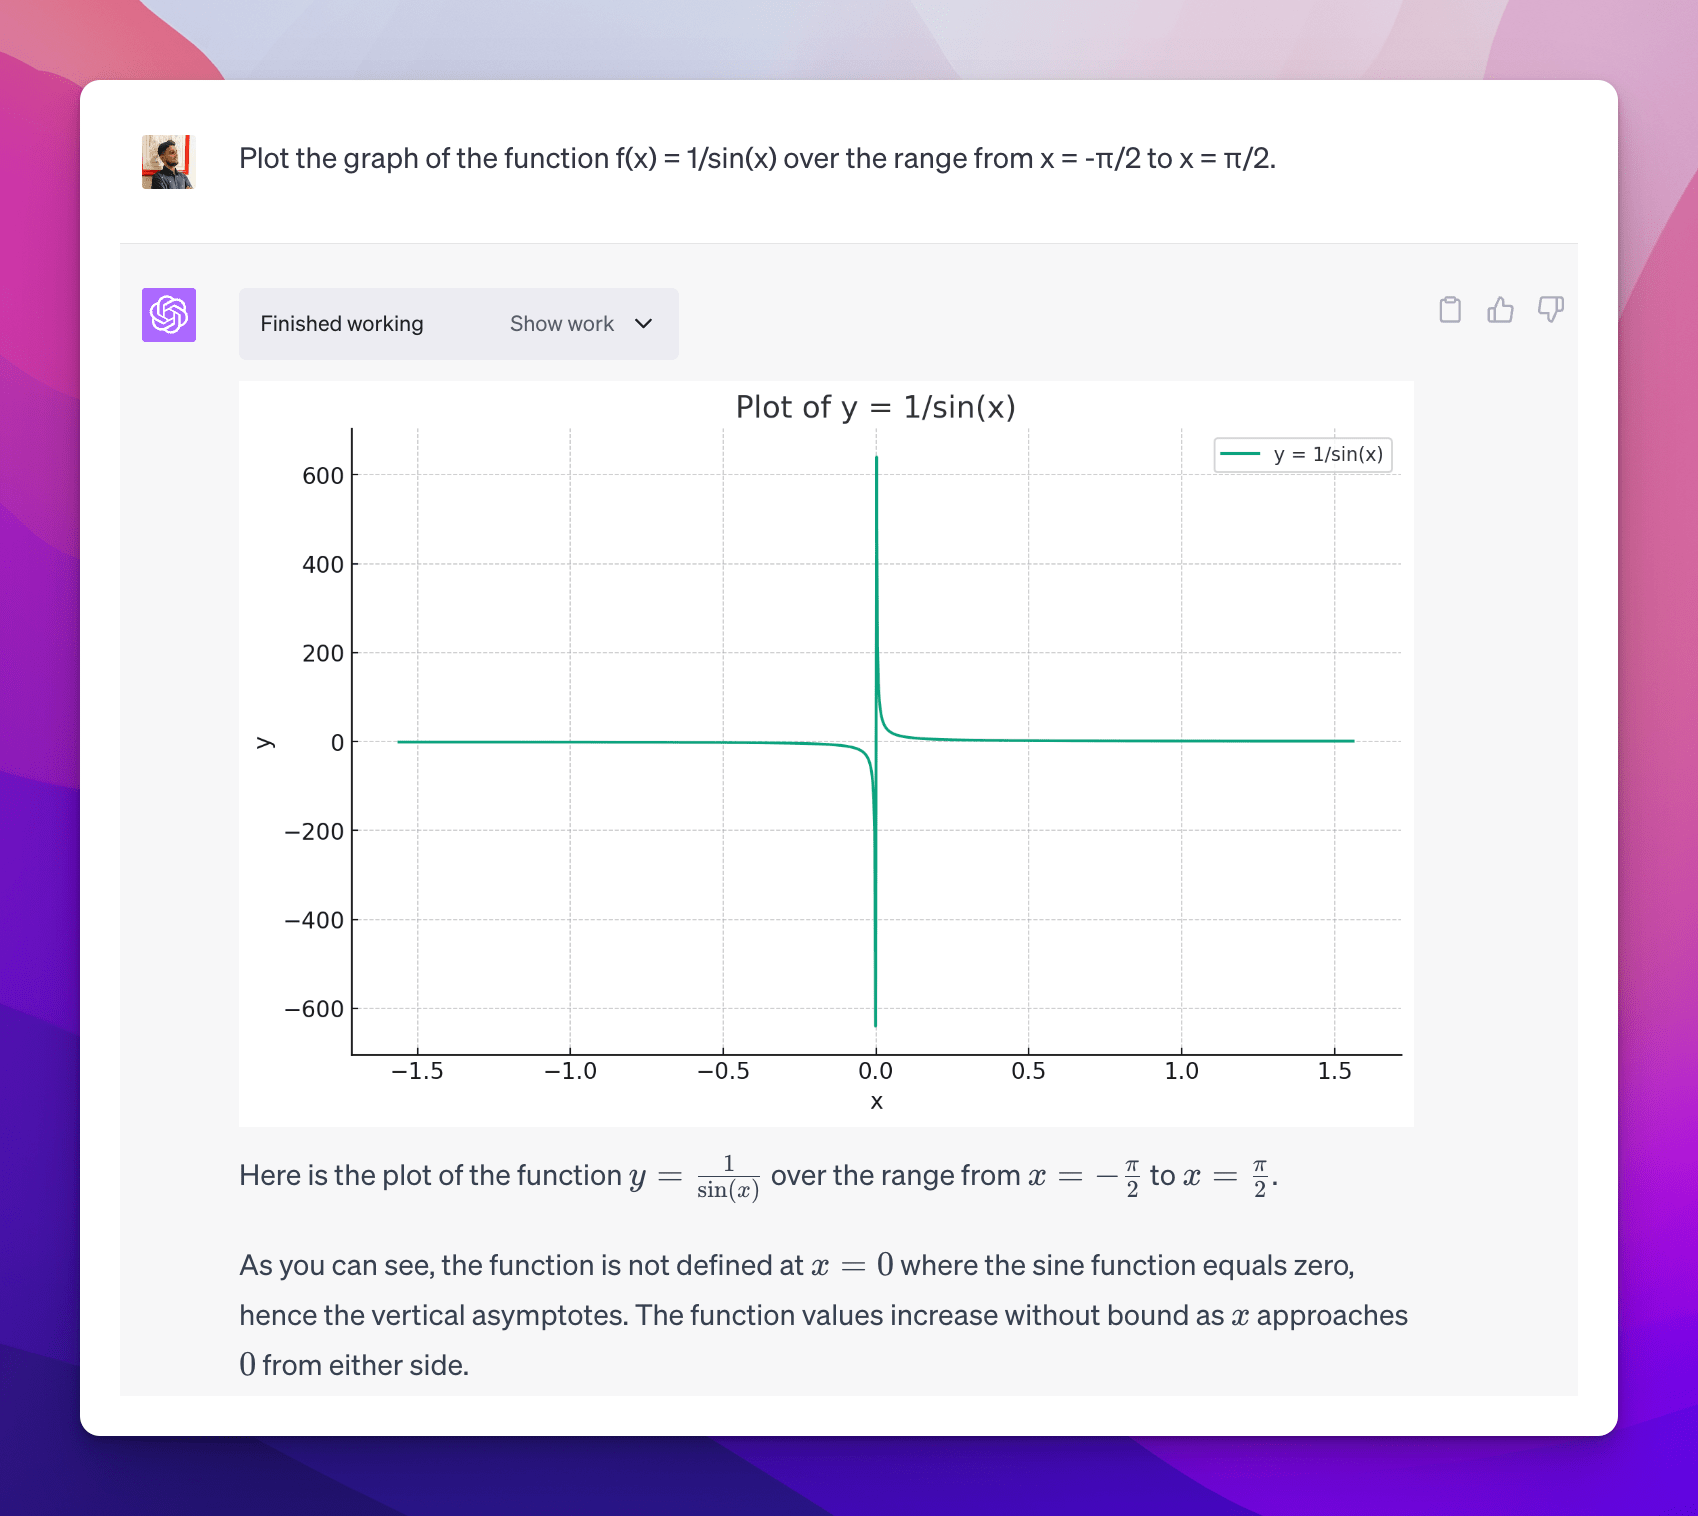
This prompt instructs the ChatGPT to generate a visual representation of the mathematical function f(x) = 1/sin(x), specifically between the range of -π/2 to π/2. This demonstrates how the function behaves and changes over these specified x values.
Prompt #2
Plot the graph of the function g(x) = e^(2x) - 3x^2 + 5 over the range from x = -2 to x = 2. Set the x-axis with equally spaced intervals of 0.5 units, and the y-axis with equally spaced intervals of 1 unit. Make sure to include a title for the graph, labeling the x-axis as "x" and the y-axis as "g(x)". Also, ensure that the graph includes gridlines to aid in visual interpretation.
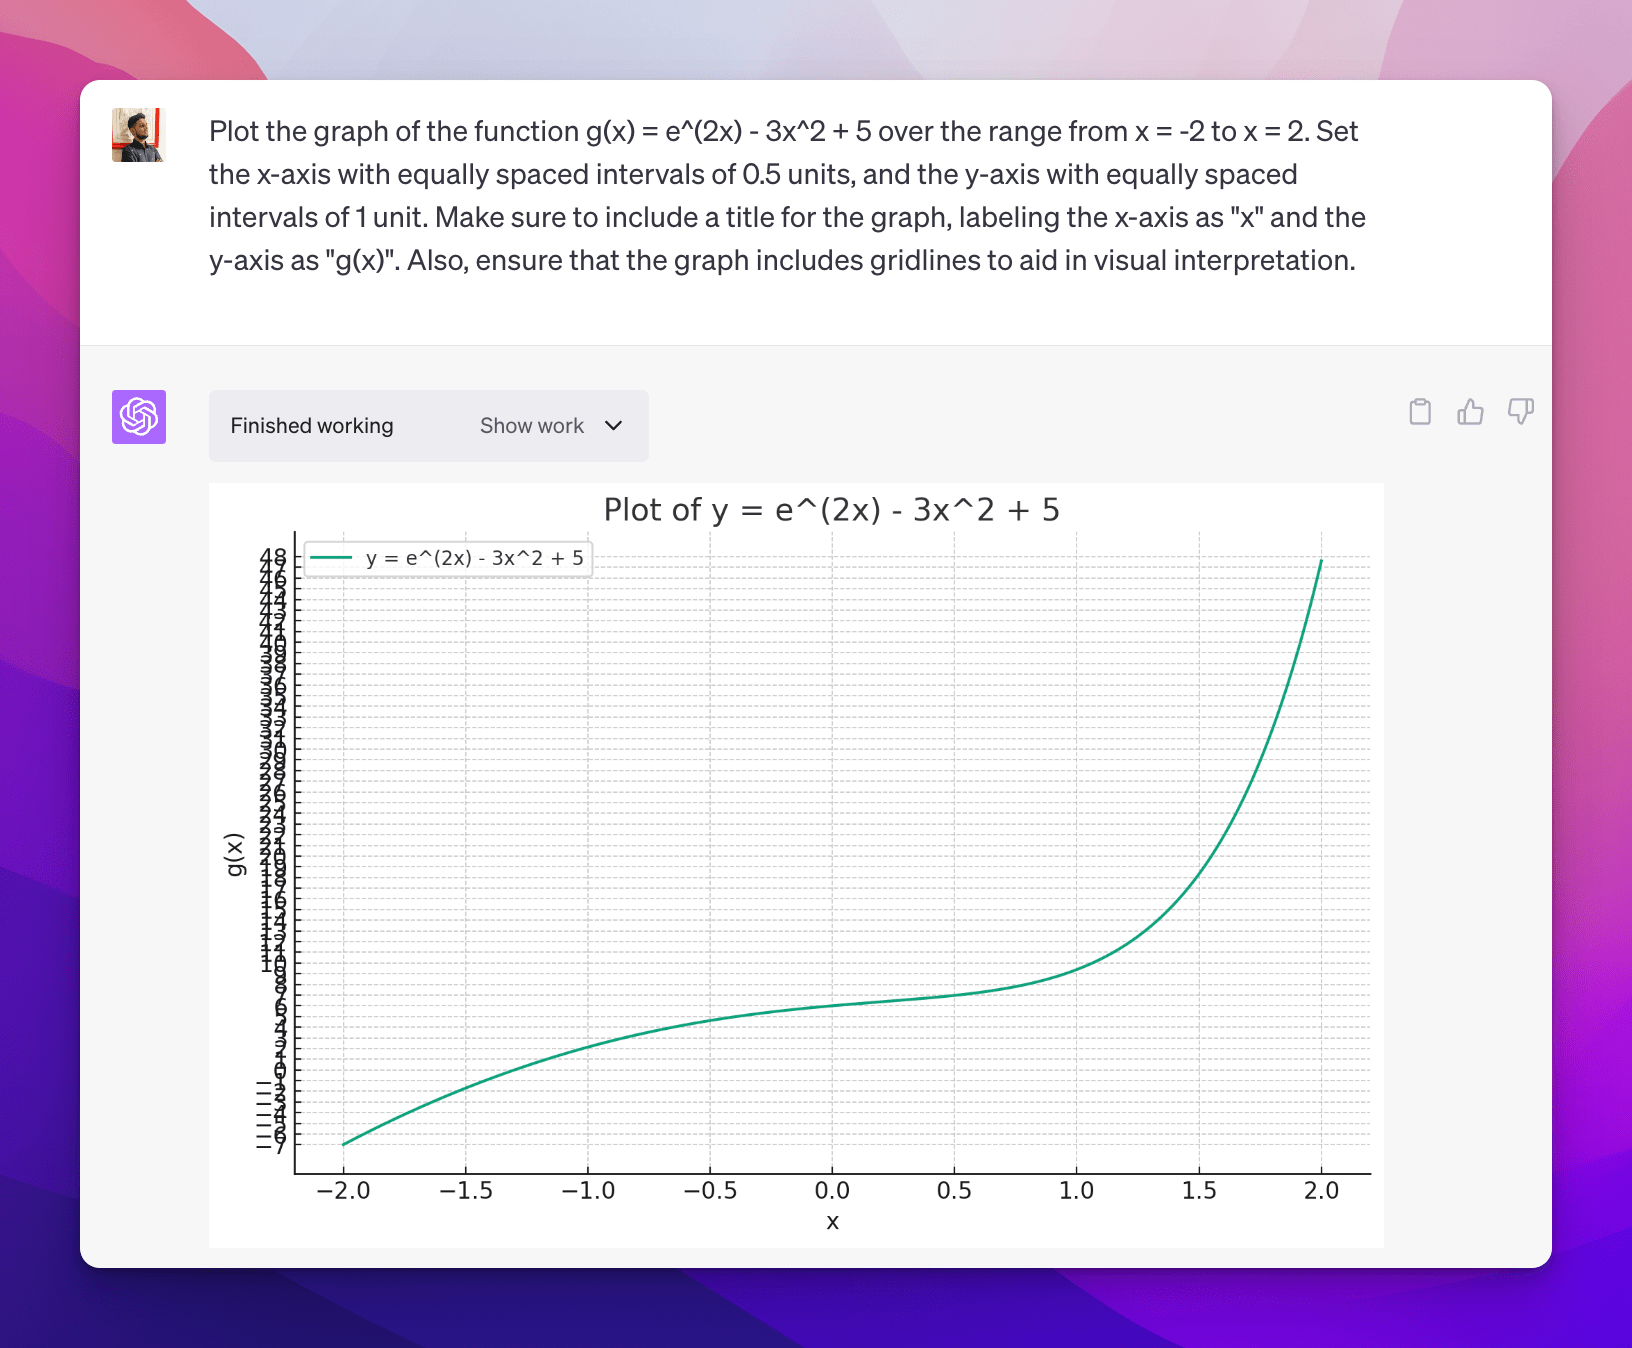
This prompt instructs the ChatGPT to create a graph for the function g(x) = e^(2x) – 3x^2 + 5 between x=-2 and x=2. It specifies axis labels, gridlines, the range, and the interval size for each axis.
🎉 You can modify the above prompts as per your use case to get the desired output. OpenAI’s GPT-4 is powerful and properly understands any prompt you provide.
Also, check some other interesting things that you can do with the OpenAI’s ChatGPT:
And if you get stuck somewhere, kindly feel free to let me know in the comments below.